同步发布到个人公众号:电子技术攻城狮-树莓派ADC 本文介绍在树莓派上使用python和qt开发一个显示ADC数据的GUI程序。开发环境使用PyCharm进行python代码远程开发,然后使用QtCreator编写QML界面。
1、新建项目
1.1、新建工程
打开PyCharm,新建工程adcMeasure,如下: 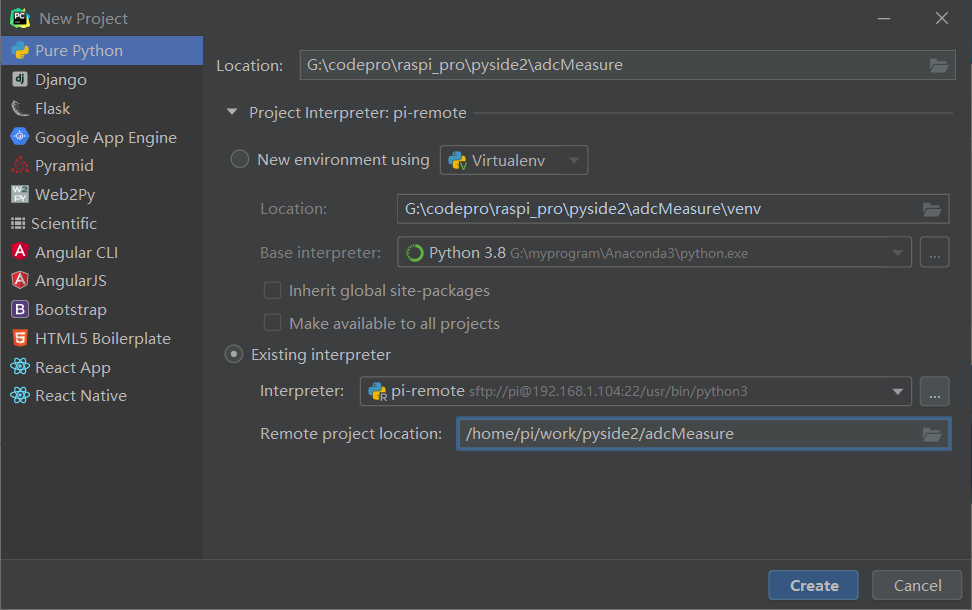
1.2、添加python主程序
adcMeasure.py 主程序如下:
1
2
3
4
5
6
7
8
9
10
11
12
13
14
15
16
17
18
19
20
21
22
23
24
25
26
27
28
29
30
31
32
33
34
35
36
37
38
39
40
41
42
43
44
45
46
47
| import os
import sys
from pathlib import Path
from PySide2.QtCore import Qt, QObject, Slot
from PySide2.QtQml import QQmlApplicationEngine
from PySide2.QtWidgets import QApplication
from adc_mcp3424 import MCP3424
class Controler(QObject):
def __init__(self):
super().__init__()
self.MCP3424 = MCP3424(6, address=0x68, rate=18)
@Slot()
def exit(self):
sys.exit()
@Slot(result=float)
def get_adc1(self):
adc1 = self.MCP3424.read_raw(1)
adc1 = adc1/100.00
return adc1
......
if __name__=='__main__':
a = QApplication(sys.argv)
a.setOverrideCursor(Qt.BlankCursor)
engine = QQmlApplicationEngine()
controler = Controler()
context = engine.rootContext()
context.setContextProperty("_Controler", controler)
engine.load(os.fspath(Path(__file__).resolve().parent / "ui/adcMeasure.qml"))
if not engine.rootObjects():
sys.exit(-1)
sys.exit(a.exec_())
|
- 程序中新建一个Controler类,用于获取ADC数值,并将ADC值传递到GUI界面进行显示。
1.3、添加界面文件
- 在项目中添加ui文件夹,并新建main.qml文件;
1
2
3
4
5
6
7
8
9
10
11
12
13
14
15
16
17
18
19
20
21
22
23
24
25
26
27
28
29
30
31
32
33
34
35
36
37
38
39
40
41
42
43
44
45
46
47
48
49
50
51
52
53
54
55
56
57
58
59
60
61
62
63
64
65
66
67
68
69
70
71
72
73
74
75
76
77
78
79
80
81
82
83
84
85
86
87
88
89
90
91
92
93
94
95
96
97
98
99
100
101
102
103
104
105
106
107
108
109
110
111
112
113
114
115
116
117
118
119
120
121
122
123
124
125
126
127
128
129
130
131
132
133
134
135
136
137
138
139
140
141
142
143
144
145
146
147
148
149
150
151
152
153
154
155
156
157
158
159
160
161
162
| import QtQuick 2.11
import QtQuick.Window 2.4
import QtQuick.Controls 2.4
import QtQuick.Controls.Styles 1.4
import QtQuick.Extras 1.4
import QtGraphicalEffects 1.0
import QtCharts 2.2
ApplicationWindow{
id:root
width: 800
height: 480
visible: true
// visibility: Window.FullScreen
background: Rectangle{
anchors.fill: parent
color: "#101010"
}
Button{
id:btnexit
background: Rectangle{
color: "#a01010"
anchors.fill: parent
radius:12
}
width: 48
height: 48
anchors{
top: parent.top
right: parent.right
topMargin: 8
rightMargin: 8
}
Text {
text: qsTr("X")
anchors.centerIn: parent
font{
pointSize: 32
}
color: "white"
}
onClicked: {
_Controler.exit();
}
}
Text {
id: title
text: qsTr("ADC Measure")
anchors{
top: parent.top
horizontalCenter: parent.horizontalCenter
topMargin: 20
}
font{
pointSize: 24
}
color: "#a0a0a0"
}
ChartView{
id:cv
width:600
height:400
anchors{
top:title.bottom
topMargin:10
left:parent.left
leftMargin:40
}
antialiasing: true
theme: ChartView.ChartThemeDark
property int timcnt: 0
property double valueCH1: 0
property double valueCH2: 0
property double valueCH3: 0
property double valueCH4: 0
ValueAxis{
id:xAxis
min: cv.timcnt < 10 ? 0 : cv.timcnt - 10
max: cv.timcnt < 10 ? 10 : cv.timcnt + 1
tickCount: 11
labelFormat: "%d"
}
ValueAxis{
id:yAxis
min: 0
max: 500
tickCount: 1
labelFormat: "%d"
}
LineSeries {
name: "CH1"
id:lines1
axisX: xAxis
axisY: yAxis
width: 3
color: "#1267D4"
}
LineSeries {
name: "CH2"
id:lines2
axisX: xAxis
axisY: yAxis
width: 3
color: "#8D7A1F"
}
LineSeries {
name: "CH3"
id:lines3
axisX: xAxis
axisY: yAxis
width: 3
color: "#8A1E1D"
}
LineSeries {
name: "CH4"
id:lines4
axisX: xAxis
axisY: yAxis
width: 3
color: "#C21FE4"
}
Timer{
id:tm
interval: 1000
repeat: true
running: true
onTriggered: {
cv.timcnt = cv.timcnt + 1
cv.valueCH1 = _Controler.get_adc1()
cv.valueCH2 = _Controler.get_adc2()
cv.valueCH3 = _Controler.get_adc3()
cv.valueCH4 = _Controler.get_adc4()
lines1.append(cv.timcnt,cv.valueCH1)
lines2.append(cv.timcnt,cv.valueCH2)
lines3.append(cv.timcnt,cv.valueCH3)
lines4.append(cv.timcnt,cv.valueCH4)
console.log("--------------------")
console.log("qml adc value1:",cv.valueCH1)
console.log("qml adc value2:",cv.valueCH2)
console.log("qml adc value3:",cv.valueCH3)
console.log("qml adc value4:",cv.valueCH4)
}
}
}
}
|
- 使用 ChartView 模块进行ADC数值显示,建立一个 Timer 定时器,每秒获取一次ADC值,然后添加到曲线中进行显示。
2、执行程序
2.1、上传程序到树莓派
在工程上右键将这个项目文件上传到树莓派中: 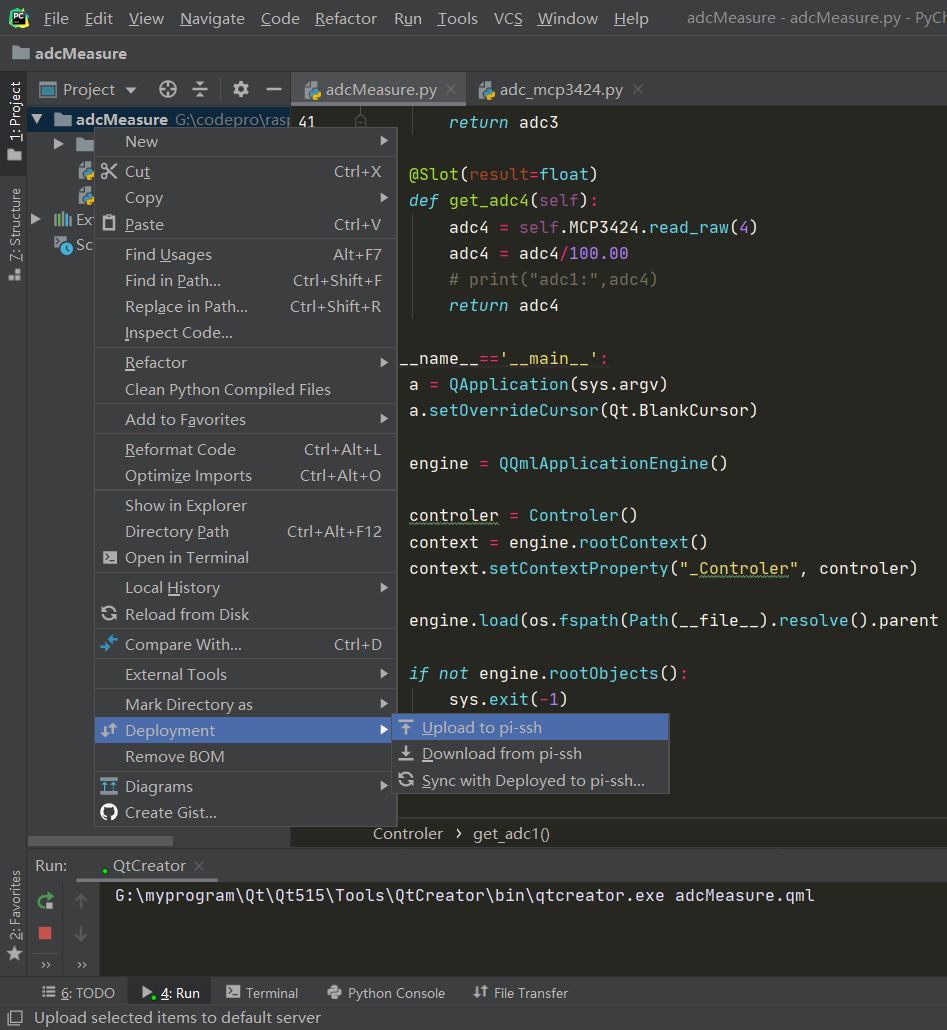
2.2、ADC硬件
树莓派连接一个I2C接口的ADC模块,这里使用的是MCP3424,它拥有四通道最大18位的精度。将四个可调变阻器连接到ADC四个通道上,这样通过调节电阻来测试变化的模拟值。
2.3、执行程序
上传后,在树莓派对应文件夹中,执行如下命令执行程序:
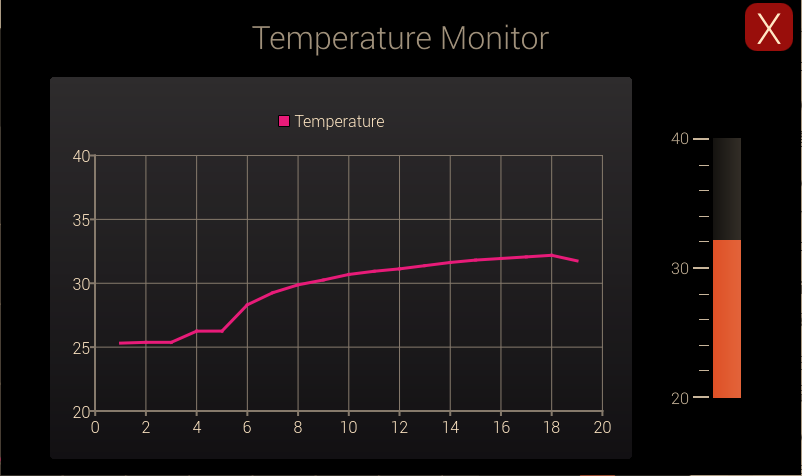
执行后可以看到显示如下: 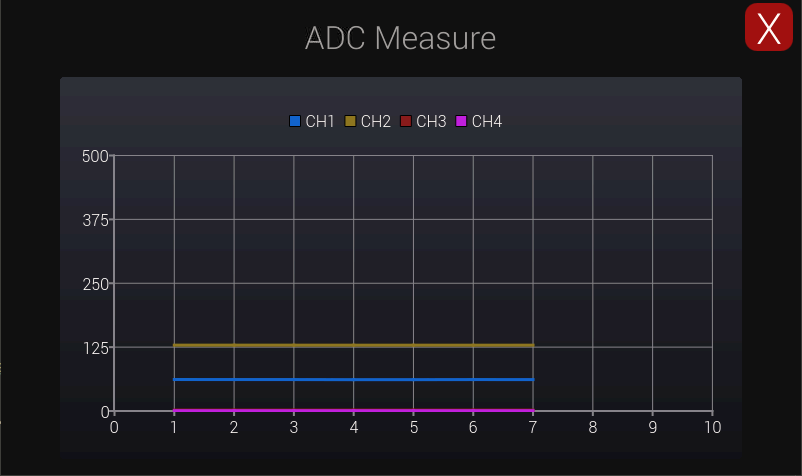 当调节电阻时候,可以看到其变化曲线:
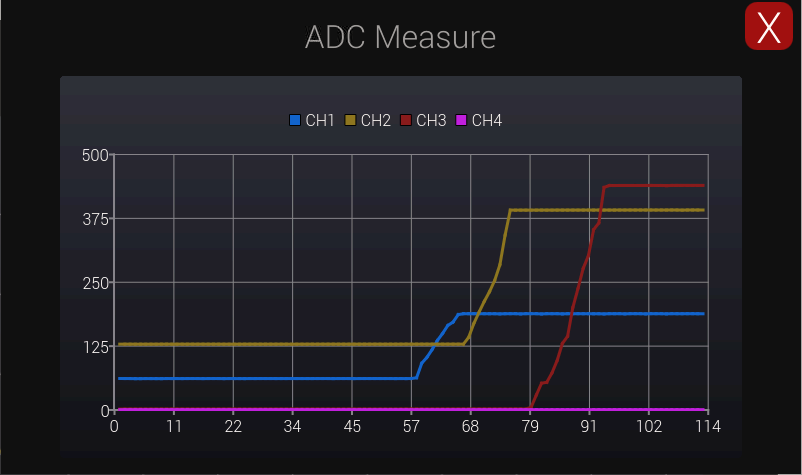
完整代码: github